
Long Island Sound Water Quality Improves, but Parts of Manhasset Bay and Hempstead Harbor Earn F Grades

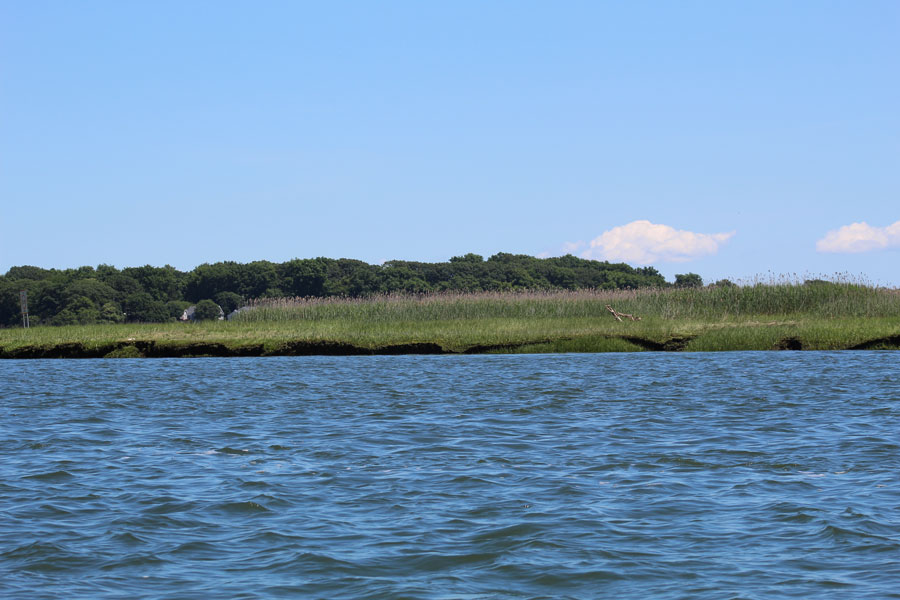
LONG ISLAND, NY – Long Island Sound’s open waters showed continued improvement in a newly released environmental report, but failing grades in parts of Manhasset Bay and Hempstead Harbor highlight the challenges that remain close to shore.
Save the Sound’s 2026 Long Island Sound Report Card, released September 22, evaluates conditions recorded during the 2025 monitoring season. All five open-water regions maintained or improved their letter grades compared with the previous report card. The Western Narrows rose from F to D, its first passing grade in 18 years of grading.
The picture was more uneven in bays and harbors. Inner Manhasset Bay and middle Hempstead Harbor received F grades, while Huntington Bay earned an A- and outer Port Jefferson Harbor received an A. Those differences underscore why an improving regional picture does not necessarily describe conditions in an individual harbor.
Open Waters Show Progress From West to East
The report divides Long Island Sound into five open-water regions. In addition to the Western Narrows’ improvement, the Western Basin rose from A- to A and the Central Basin improved from A to A+. The Eastern Narrows retained a B, and the Eastern Basin retained an A+.
Save the Sound credits decades of work to reduce nitrogen pollution, including investments in wastewater treatment plants in New York and Connecticut. Its release announcing the findings also cautions that warming water and worsening stormwater runoff threaten those gains.
How Nassau and Suffolk Bays and Harbors Scored
The following table presents the report’s 19 bay segments along mainland Nassau and Suffolk. Long Island Guide counted 10 with grades in the A or B ranges and nine in the C, D or F ranges. These are individual monitoring segments, rather than ratings for entire municipalities.
| Bay or harbor segment | 2026 report card grade |
|---|---|
| Inner Manhasset Bay | F |
| Middle Manhasset Bay | D- |
| Outer Manhasset Bay | C- |
| Middle Hempstead Harbor | F |
| Outer Hempstead Harbor | D+ |
| Mill Neck Creek | B |
| Oyster Bay | B+ |
| Inner Cold Spring Harbor | D |
| Outer Cold Spring Harbor | C+ |
| Lloyd Harbor | B- |
| Huntington Harbor | B- |
| Huntington Bay | A- |
| Centerport Harbor | B |
| Northport Harbor | D |
| Northport Bay | C+ |
| Nissequogue River | B |
| Inner Port Jefferson Harbor | B+ |
| Middle Port Jefferson Harbor | A- |
| Outer Port Jefferson Harbor | A |
The table illustrates meaningful differences within the same waterway. Port Jefferson Harbor’s grades ranged from B+ in its inner segment to A in its outer segment. Manhasset Bay ranged from F in its inner segment to C- in its outer segment. Fishers Island’s two West Harbor segments, listed separately in the report, both earned A+ grades and are outside this mainland comparison.
Low Oxygen Remains a Concern in Local Bays
Across the full study area, including Connecticut and other New York shorelines, only 56% of the 62 graded bay segments earned an A or B. Half received a C, D or F for dissolved oxygen, which Save the Sound identifies as the leading challenge in the bays and harbors.
Low oxygen can impair the growth and reproduction of aquatic organisms and, under severe conditions, cause death. Nitrogen pollution contributes to the problem by encouraging excessive algae growth. As organic material decomposes, oxygen in the water can be depleted.
Local pollution sources include wastewater infrastructure, septic systems, fertilizer and stormwater runoff. Because bays have their own watersheds and circulation patterns, their conditions can differ from those of nearby open water. A favorable grade offshore therefore should not be assumed to apply to a sheltered inlet.
What the Grades Measure
The report assesses how well water supports aquatic life and marine habitats. Open-water grades use dissolved oxygen, chlorophyll a, water clarity and dissolved organic carbon. Bay grades use dissolved oxygen, oxygen saturation, chlorophyll a, water clarity and seaweed conditions.
Open-water monitoring comes from the Connecticut Department of Energy and Environmental Protection, the Interstate Environmental Commission and the New York City Department of Environmental Protection. Bay data are collected through the Unified Water Study, which uses standardized methods across participating organizations.
These ecological grades should not be used to determine whether a beach is safe for swimming or shellfish are safe to harvest. Those decisions require the relevant public health testing, advisories and closures. The report card is also retrospective: its 2026 publication date refers to findings from 2025, rather than a live reading of water conditions.
Key Facts & Details
| Measure | Details |
|---|---|
| Report | 2026 Long Island Sound Report Card |
| Publisher | Save the Sound |
| Released | September 22, 2026 |
| Monitoring period | 2025 season |
| Waterway | Long Island Sound and its monitored bays and harbors |
| Full report coverage | Five open-water regions and 62 segments across 46 bays and harbors |
| Mainland local comparison | 19 segments along Nassau and Suffolk; 10 earned grades in the A or B ranges; nine earned grades in the C, D or F ranges |
| Western Narrows | D, improving from F in the previous report card |
| Bay segments earning A or B grades Sound-wide | 56% |
| Purpose | Ecological health assessment; separate from swimming and shellfish safety determinations |
| Historical data and methods | Sound Health Explorer |
Methodology: Long Island Guide transcribed the overall grades for report locations 42 through 60 from the published Bay Grades table and grouped them by letter grade, retaining plus and minus distinctions in the comparison above. The count excludes Queens, the mainland north shore of the Sound and Fishers Island. Grades are Save the Sound’s assessments; the local grouping and counts are Long Island Guide’s analysis.
For Long Island’s waterfront communities, the report offers evidence of regional progress alongside a reason to keep examining conditions close to home. Better open-water grades mark an important gain, but the contrast among nearby bays and harbor segments shows why local monitoring and pollution reduction remain essential to the Sound’s recovery.
Are you ready for fall on Long Island? Check out these local seasonal guides:
🍎 Apple Picking | 🍂 Fall Festivals & Farm Activities | 👻 Haunted Houses | 🎃 Pumpkin Picking