
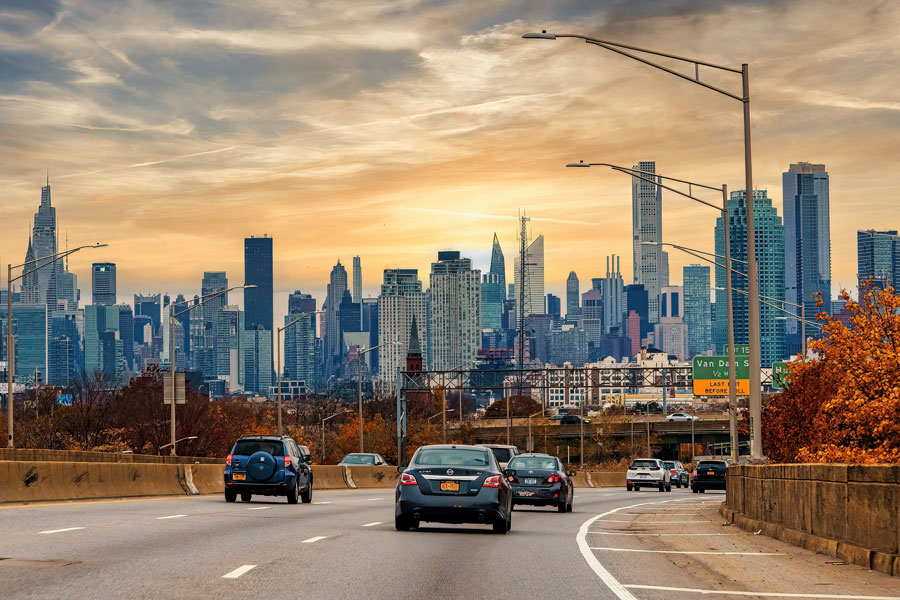
Long Island roads with the most pedestrian fatalities include major routes that residents use every day, from Sunrise Highway and Middle Country Road to Hempstead Turnpike and Route 110. A LongIslandGuide.com analysis of federal crash records identified 333 pedestrian deaths in Nassau County and Suffolk County during 2020–2024, with Suffolk’s NY 27 route segment recording the highest total among the road groups analyzed.
The analysis uses the National Highway Traffic Safety Administration’s Fatality Analysis Reporting System (FARS). It counts people killed, rather than simply counting crashes, and compares the portion of each road or route within one county. Brooklyn and Queens are outside the scope of this page.
Roads With the Most Pedestrian Fatalities
The table lists road groups with at least five pedestrian deaths during the five-year period. Numbered routes are grouped across their recorded local street names, while identifiable spelling variants of named roads are combined. County segments are ranked separately: the Suffolk total for NY 27 does not include Nassau’s four deaths on that route.
| Road or route | County | Pedestrian deaths, 2020–2024 |
|---|---|---|
| NY 27 — Sunrise Highway / eastern Montauk Highway | Suffolk | 22 |
| NY 25 — Middle Country Road / Jericho Turnpike / Main Street | Suffolk | 17 |
| NY 24 — Hempstead Turnpike / Fulton Avenue | Nassau | 16 |
| NY 110 — Broadhollow Road / New York Avenue / Broadway | Suffolk | 13 |
| CR 13 — Fifth Avenue / Wicks Road / Crooked Hill Road | Suffolk | 9 |
| Merrick Road | Nassau | 9 |
| CR 100 — Suffolk Avenue | Suffolk | 8 |
| NY 347 — Nesconset Highway | Suffolk | 6 |
| NY 112 — Medford Avenue / Route 112 | Suffolk | 6 |
| CR 80 — Montauk Highway | Suffolk | 6 |
| CR 83 — North Ocean Avenue corridor | Suffolk | 6 |
| CR 46 — William Floyd Parkway | Suffolk | 5 |
| I-495 — Long Island Expressway | Suffolk | 5 |
| NY 454 — Veterans Memorial Highway | Suffolk | 5 |
Tied totals have equal standing. A road’s absence from the table means it did not reach the five-death threshold under these grouping rules; it does not establish that the road is safe. Records explicitly identifying ramps or service roads are kept separate from the main route totals.
What the Leading Road Totals Mean
Suffolk’s NY 27 corridor recorded 22 pedestrian deaths. That figure covers records coded to NY 27, including sections named Sunrise Highway and eastern sections named Montauk Highway. It should not be presented as 22 deaths on Sunrise Highway alone. Separately coded NY 27A and CR 80 records are not included in that figure.
Suffolk’s NY 25 corridor followed with 17 deaths. Its total combines records identified as Middle Country Road, Jericho Turnpike, Main Street, and records carrying only the route number. The count therefore describes a route extending through multiple communities, rather than one downtown or intersection.
In Nassau, NY 24, including Hempstead Turnpike and Fulton Avenue, recorded 16 pedestrian deaths, the county’s highest total among the grouped roads. Suffolk’s Route 110 recorded 13 deaths across names including Broadhollow Road, New York Avenue, and Broadway. Merrick Road in Nassau and the CR 13 corridor in Suffolk each recorded nine.
Pedestrian Deaths in Nassau and Suffolk by Year
| Year | Nassau County | Suffolk County | Combined |
|---|---|---|---|
| 2020 | 25 | 30 | 55 |
| 2021 | 32 | 43 | 75 |
| 2022 | 21 | 51 | 72 |
| 2023 | 22 | 50 | 72 |
| 2024 | 24 | 35 | 59 |
| 2020–2024 | 124 | 209 | 333 |
Suffolk accounted for 209 of the 333 deaths, or about 63 percent, compared with 124 in Nassau. The highest combined annual total was 75 in 2021; the 2024 annual file records 59. These are counts by crash location, not the home county of the person killed, and they do not measure each county’s risk per resident or per walking trip.
Most Deaths Occurred in Darkness
The crash records classified 240 of the 333 pedestrian deaths, about 72 percent, as occurring in darkness. Of these, 182 were in crashes recorded as “Dark – Lighted” and 58 as “Dark – Not Lighted.” Another 78 deaths occurred in daylight, nine at dawn, and six at dusk.
The lighting categories describe reported conditions at the crash scene. They do not measure the quality of street lighting or establish what caused a crash. Without information about how many people were walking at different times, these counts also cannot establish the relative risk of a daytime or nighttime trip.
What New York State’s Data Adds
The New York Metropolitan Transportation Council’s Crash Data Explorer provides a separate view of pedestrian injuries using data from the Traffic Safety Statistical Repository (TSSR), maintained by the Institute for Traffic Safety Management & Research. Its Nassau and Suffolk pedestrian tables record 821 serious pedestrian injuries during 2020–2024, showing that the consequences extend beyond fatal crashes.
The state-based tables record 339 pedestrian deaths for those years, compared with 333 under this page’s FARS selection. These are separate reporting systems with differing classifications and update processes, so their totals are not combined. New York’s pedestrian reporting definition also includes people on certain personal conveyances, while this federal analysis selects the person type specifically coded “Pedestrian.” No single cause is assigned here to the six-death difference.
How This Analysis Was Prepared
LongIslandGuide.com downloaded the national FARS CSV files for 2020 through 2024 and joined the accident and person tables by year and crash identifier. The selection includes New York crashes coded to Nassau County or Suffolk County and people coded as pedestrians with fatal injuries. Bicyclists and people coded as nonmotorists on personal conveyances are excluded from the federal totals. The 333 deaths occurred in 327 distinct crashes.
Road grouping uses the primary trafficway field, not the cross-street field. Numbered routes are grouped within each county; named-road spelling variants are consolidated where identifiable. Different numbered routes are not combined merely because they share a local name, such as Montauk Highway. These are county route or road groups, not equal-length street segments.
One Suffolk record has an unspecified primary road. Another, from 2023, carries the conflicting label “SR-27 MERRICK RD.” Both deaths remain in the county and annual totals, but neither is assigned to a ranked road group. The raw labels are preserved in the supporting data. Explicit ramp and service-road labels are also retained separately. Records that do not identify a service road cannot be reclassified from their road label alone.
The 2024 FARS file is the annual release issued April 1, 2026 and may change when finalized. The state comparison uses NYMTC’s published 2019–2024 tables, restricted to 2020–2024. TSSR’s current notice says updates are paused during a state crash-system transition and identifies February 5, 2026 as its available snapshot date. The analysis was prepared November 9, 2026.
Why This Is a Fatality Ranking, Not a Walking-Risk Score
Longer routes can accumulate more deaths than shorter streets, and roads with more people walking or more vehicle traffic can produce higher totals. This ranking does not adjust for road length, pedestrian activity, vehicle volume, or the number of crossings. It therefore identifies roads with the most recorded pedestrian deaths under the stated rules, rather than establishing which road is most dangerous for an individual walking trip.
The Tri-State Transportation Campaign’s March 2012 report also ranked county road segments by pedestrian fatality counts, using 2008–2010 data. It identified Nassau’s NY 24 corridor as the regional leader. The different time windows and grouping decisions mean the old and new totals should not be treated as a direct trend comparison.
Key Facts & Details
| Detail | Information |
|---|---|
| Geographic coverage | Nassau County and Suffolk County on Long Island |
| Analysis period | 2020–2024 |
| Federal pedestrian deaths | 333 people in 327 crashes |
| County totals | Nassau: 124; Suffolk: 209 |
| Highest road-group total | NY 27, including Sunrise Highway and eastern Montauk Highway in Suffolk County: 22 |
| Nassau’s highest road-group total | NY 24 / Hempstead Turnpike / Fulton Avenue: 16 |
| Primary data source | NHTSA Fatality Analysis Reporting System |
| Additional sources | NYMTC Crash Data Explorer and ITSMR TSSR |
| Road table threshold | At least five pedestrian deaths per county road group |
| Prepared | November 9, 2026; 2024 federal annual data subject to revision |
Long Island’s pedestrian fatality records show that the human cost of traffic crashes reaches across major commercial routes, local roads, and expressways. Reading the counts alongside injury data, road conditions, and walking activity provides a more useful basis for understanding where further safety investigation is needed. For background on the routes discussed here, explore LongIslandGuide.com’s highways and parkways guide.