
New Federal Study Maps Long Island Groundwater Flooding Hazards, With South Shore More Susceptible Than North

LONG ISLAND, NY – Coastal areas and places near rivers, ponds and other surface waters face the greatest potential for groundwater flooding on Long Island, according to a new federal study that examines how water rising from below ground can threaten basements and underground infrastructure.
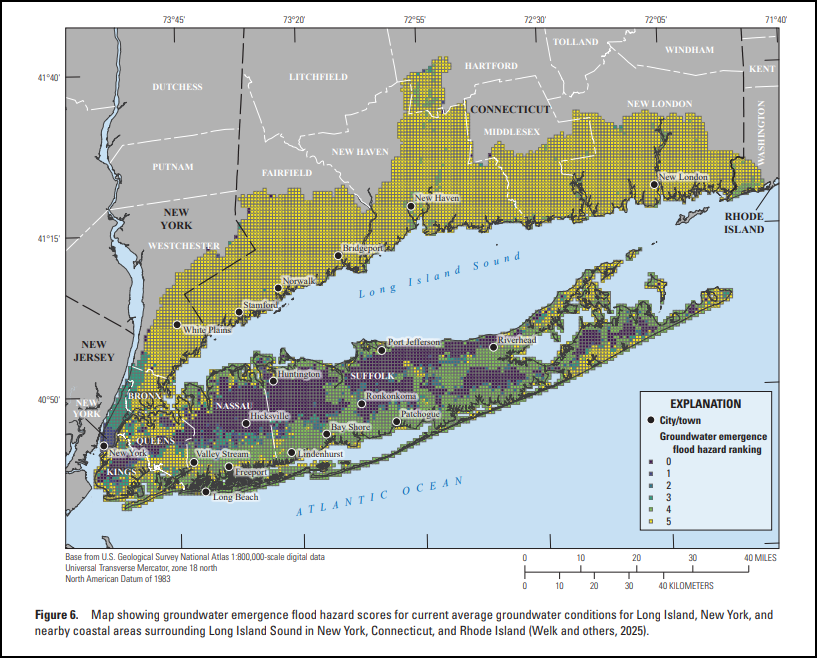
The U.S. Geological Survey report, published October 15, 2026, found that groundwater flooding hazard scores along Long Island’s northern coastline generally were lower than those along its southern coast. Researchers attributed the difference to the North Shore’s generally steeper terrain and greater depths to the water table, compared with flatter South Shore areas where groundwater lies closer to the surface.
The study covers all of geographic Long Island, including Nassau and Suffolk, along with nearby areas surrounding Long Island Sound. Its maps assess regional conditions rather than the likelihood that an individual home will flood.
Flooding Can Come From Below Ground
Groundwater emergence flooding occurs when a rising water table reaches the ground surface or infrastructure below it. That creates a different pathway for flooding from rainwater running across streets or storm surge moving inland from the coast.
Researchers evaluated groundwater depth and soil characteristics, then compared the results with land-cover information to identify developed areas where basements and subsurface infrastructure could be exposed. The work was conducted with the U.S. Environmental Protection Agency’s Long Island Sound Partnership as part of a broader investigation of how different sources of flooding can combine.
How the Hazard Scores Work
The approximately 3,100-square-mile study area was divided into 11,407 grid cells, each measuring 900 meters by 900 meters, or roughly 3,000 feet across. Those totals cover the full multistate study area, not Nassau and Suffolk alone.
Each cell received a groundwater flooding hazard score from 0 to 5. Higher scores indicate greater susceptibility under the study’s rules. Researchers used the shallowest modeled groundwater depth within each cell and the share of its area occupied by soil groups B, C and D, which drain more slowly than the most freely draining soils.
| Hazard score | Depth to groundwater | Share of cell occupied by soil groups B, C and D |
|---|---|---|
| 5 | 6 feet or less | More than 50% |
| 4 | 6 feet or less | 50% or less |
| 3 | More than 6 feet through 15 feet | More than 50% |
| 2 | More than 6 feet through 15 feet | 50% or less |
| 1 | More than 15 feet | More than 50% |
| 0 | More than 15 feet | 50% or less |
A score of 5 therefore identifies a combination of shallow groundwater and a greater presence of slower-draining soils. A score of 0 does not establish that a location is safe from storm surge, rainfall flooding or every other source of water damage.
Higher Sea Level Changes Some Coastal Results
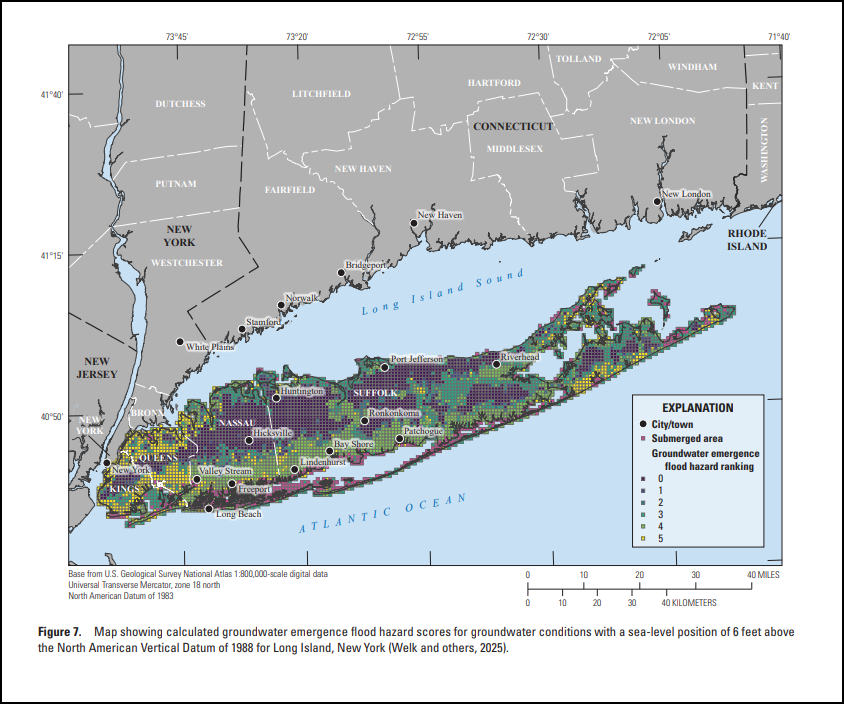
Researchers also evaluated Long Island under a simulated sea-level position of 6 feet above the North American Vertical Datum of 1988, the elevation reference used for that scenario. This is a specified water elevation, rather than a statement that sea level will rise another 6 feet by a particular year.
Some coastal areas, particularly along the South Shore, were submerged in that simulation. Those cells were displayed separately and were not assigned groundwater flooding hazard scores. Some areas adjoining the submerged cells received higher scores than under the current average conditions.
Away from the coast, scores generally remained similar between the two scenarios. The findings therefore describe a geographically uneven response, with greater changes in some coastal locations.
What the Maps Can and Cannot Show
The full report includes maps of groundwater depth and hazard scores, including the current-condition results in Figure 6 and the higher-sea-level scenario in Figure 7. Its regional grid can help identify areas warranting closer investigation, but conditions can vary within a single cell.
The Long Island groundwater model inputs represent average annual pumping and recharge conditions from 2010 through 2019. The October 2026 publication date should not be read as the date of a new islandwide survey of groundwater levels.
The authors caution that average conditions do not capture the full range of monthly and seasonal groundwater fluctuations. Where seasonal high groundwater differs substantially from the average, the analysis may underestimate the hazard. It also excludes locally saturated layers above the regional water table, known as perched water zones.
The report was newly published this month, while the associated geospatial data release listed by USGS dates to July 28, 2025.
Key Facts & Details
| Measure | Details |
|---|---|
| Report publication | October 15, 2026 |
| Research agency | U.S. Geological Survey, in cooperation with EPA’s Long Island Sound Partnership |
| Local coverage | All of geographic Long Island, including Nassau County and Suffolk County |
| Broader coverage | Nearby areas surrounding Long Island Sound in New York, Connecticut and Rhode Island |
| Full study area | Approximately 3,100 square miles |
| Mapping grid | 11,407 cells, each 900 meters by 900 meters |
| Hazard scoring | 0 to 5, based on groundwater depth and soil characteristics |
| Highest-score conditions | Groundwater 6 feet or less below the surface and soil groups B, C and D covering more than half the cell |
| Long Island baseline model conditions | Average annual pumping and groundwater recharge, 2010–2019 |
| Additional scenario | Sea-level position of 6 feet above NAVD 88 |
| Associated data release | July 28, 2025 |
| Source report | USGS Scientific Investigations Report 2026–5042 |
The study adds groundwater to the picture of Long Island’s flooding hazards, showing why coastal elevation alone cannot explain every potential problem below ground. For Nassau and Suffolk, its value lies in identifying regional patterns and places that may warrant closer examination, while leaving the assessment of a particular property to more detailed local information.
Are you ready for fall on Long Island? Check out these local seasonal guides:
🍎 Apple Picking | 🍂 Fall Festivals & Farm Activities | 👻 Haunted Houses | 🎃 Pumpkin Picking