
Long Island Home Prices Rose to $860,000 in Nassau and $740,000 in Suffolk as Inventory Fell in September

LONG ISLAND, NY – Single-family home prices rose in both Nassau and Suffolk counties in September 2026, while the number of homes available for sale fell from a year earlier, according to OneKey MLS’s latest county market reports.
Nassau’s median single-family sale price reached $860,000, up 2.1% from September 2025. Suffolk’s median reached $740,000, an increase of 2.8%. Completed sales moved in opposite directions: Nassau recorded 757 closings, down 4.1%, while Suffolk recorded 1,041, up 4.6%.
The figures come from OneKey’s September Nassau County report and September Suffolk County report, both current as of October 7. OneKey published its broader regional September market announcement on October 14.
Fewer Single-Family Homes Available in Both Counties
Nassau had 2,318 single-family homes for sale, compared with 2,357 a year earlier, a decline of 1.7%. Suffolk’s inventory fell 2.9%, from 3,315 to 3,220.
New listings also declined. Nassau recorded 929, down 10.4% from 1,037 in September 2025. Suffolk recorded 1,287, down 5.6% from 1,364. Long Island Guide’s calculation from those county figures puts combined inventory at 5,538 homes, down 2.4%, and combined new listings at 2,216, down 7.7%.
| Single-family measure | Nassau County, September 2026 | Annual change | Suffolk County, September 2026 | Annual change |
|---|---|---|---|---|
| Median sale price | $860,000 | +2.1% | $740,000 | +2.8% |
| Closed sales | 757 | -4.1% | 1,041 | +4.6% |
| New listings | 929 | -10.4% | 1,287 | -5.6% |
| Homes for sale | 2,318 | -1.7% | 3,220 | -2.9% |
| Average days on market until sale | 40 | -7.0% | 40 | -9.1% |
| Original list price received | 99.8% | Up 0.9 percentage points | 101.0% | Up 0.5 percentage points |
The local inventory declines contrast with OneKey’s broader service-area announcement, which reported a 2.2% increase in inventory across property types. That regional figure should not be presented as an increase in available single-family homes in Nassau and Suffolk.
Homes Sold Faster Than a Year Earlier
Single-family homes averaged 40 days on the market in each county, compared with 43 days in Nassau and 44 in Suffolk a year earlier. Suffolk sellers received an average of 101.0% of their original asking price, while Nassau sellers received 99.8%.
Those averages do not mean every seller received an above-asking offer or every home found a buyer in 40 days. Countywide results combine transactions across different communities, price ranges and property conditions.
Condo Prices Moved in Opposite Directions
Nassau’s median condominium sale price fell 2.6%, from $806,000 to $785,000, while Suffolk’s rose 12.6%, from $517,500 to $582,500. Condo closings declined in both counties, to 63 in Nassau and 124 in Suffolk.
| Property type and county | September 2025 median | September 2026 median | Annual price change | September 2026 closings |
|---|---|---|---|---|
| Condos, Nassau | $806,000 | $785,000 | -2.6% | 63 |
| Condos, Suffolk | $517,500 | $582,500 | +12.6% | 124 |
| Co-ops, Nassau | $347,500 | $350,000 | +0.7% | 75 |
| Co-ops, Suffolk | $270,000 | $285,000 | +5.6% | 42 |
The Longer View Also Shows Higher Prices
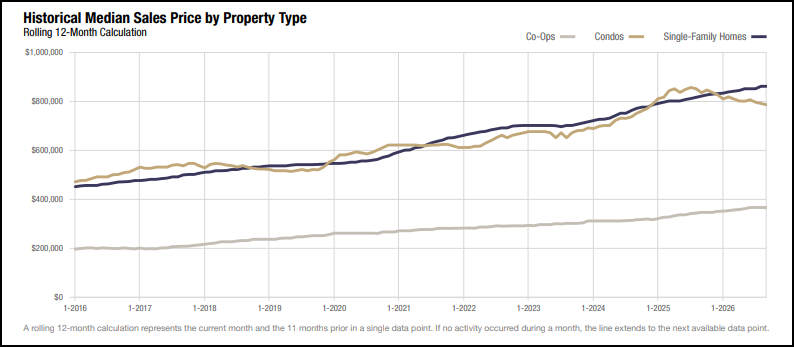
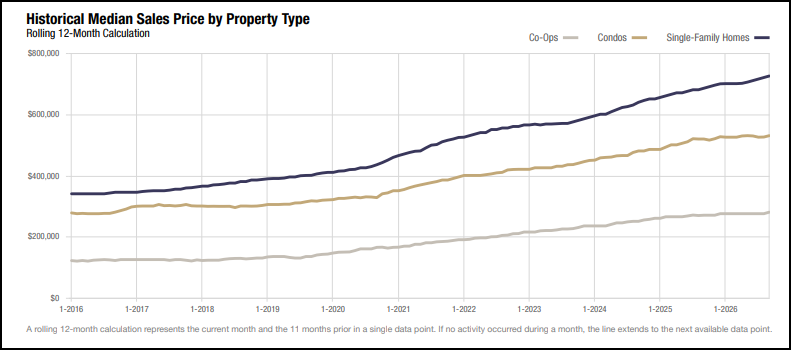
For the 12 months through September 2026, Nassau’s single-family median was $860,000, up 4.9% from $820,000 during the preceding 12-month period. Suffolk’s was $725,000, up 5.8% from $685,000.
Nassau:
Suffolk:
Single-family closings over those rolling 12-month periods declined 0.4% in each county. Nassau recorded 8,260, compared with 8,296 previously, while Suffolk recorded 11,053, compared with 11,093. These are rolling annual comparisons, not January-through-September totals.
A median is the midpoint of recorded sale prices. Changes can reflect which homes sold as well as changes in market pricing, so a rising county median does not establish that every home gained the same percentage in value. OneKey also notes that its price and list-price measures do not account for sale concessions or downpayment assistance.
Key Facts & Details
| Measure | Details |
|---|---|
| Reporting period | September 2026, compared with September 2025 |
| Area covered | Nassau County and Suffolk County |
| Nassau single-family median | $860,000, up 2.1% |
| Suffolk single-family median | $740,000, up 2.8% |
| Combined single-family inventory | 5,538 homes, down approximately 2.4% |
| Combined new single-family listings | 2,216, down approximately 7.7% |
| Average single-family marketing time | 40 days in each county |
| County report data date | October 7, 2026 |
| Regional announcement | October 14, 2026 |
| Primary sources | OneKey MLS Nassau County report and Suffolk County report |
Methodology: Figures come from OneKey MLS’s September 2026 county reports. Long Island Guide calculated combined inventory and new-listing totals by adding the two counties, then compared those sums with September 2025. Single-family, condominium and co-op results are reported separately. Combined medians were not calculated by averaging county medians.
September’s results show higher single-family prices and fewer available listings in both counties, alongside different trends in completed sales. Buyers looking across Long Island therefore faced a market that varied by county and property type, with the broader region’s inventory gains offering little evidence of additional single-family choice in Nassau or Suffolk.
Are you ready for fall on Long Island? Check out these local seasonal guides:
🍎 Apple Picking | 🍂 Fall Festivals & Farm Activities | 👻 Haunted Houses | 🎃 Pumpkin Picking