

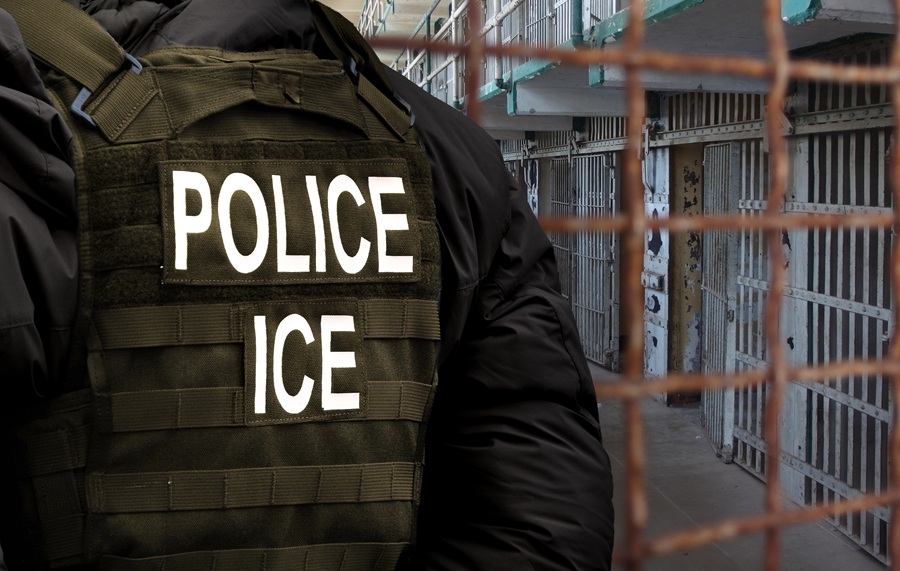
HEMPSTEAD, NY – Nearly 3,000 immigration arrests were recorded across Long Island since President Donald Trump returned to office, according to a LongIslandGuide.com analysis of newly released federal immigration enforcement data.
The analysis identified 2,940 U.S. Immigration and Customs Enforcement arrests recorded in Nassau and Suffolk counties from Jan. 20, 2025 through the latest available federal data released in August 2026.
Nassau County accounted for 2,008 arrests, or approximately 68% of the Long Island total, while 932 arrests were recorded in Suffolk County.
Bethpage had the largest number of apprehensions recorded in any Long Island community, followed by Hempstead, Mineola, Brentwood, Freeport and East Meadow.
The findings come from individual-level ICE administrative arrest records obtained through a Freedom of Information Act lawsuit and made publicly available by the Deportation Data Project, a research project based at the University of California, Berkeley and UCLA.
The latest release includes ICE enforcement data through Aug. 6, 2026 and, for the first time, provides an “Apprehension City” field that allows researchers and journalists to examine arrest activity at a much more local level.
Bethpage Leads Long Island in ICE Arrests Recorded in New Data
Bethpage topped the Long Island list with 344 ICE arrests recorded during the period analyzed. Hempstead followed with 272, while Mineola had 251.
Brentwood had the highest total in Suffolk County with 118 arrests, followed by Central Islip with 94 and Riverhead with 81.
| Rank | Community | County | ICE Arrests |
|---|---|---|---|
| 1 | Bethpage | Nassau | 344 |
| 2 | Hempstead | Nassau | 272 |
| 3 | Mineola | Nassau | 251 |
| 4 | Brentwood | Suffolk | 118 |
| 5 | Freeport | Nassau | 116 |
| 6 | East Meadow | Nassau | 113 |
| 7 | Westbury | Nassau | 108 |
| 8 | Williston Park | Nassau | 101 |
| 9 | Central Islip | Suffolk | 94 |
| 10 | Syosset | Nassau | 82 |
| 11 | Riverhead | Suffolk | 81 |
| 12 | Huntington Station | Suffolk | 73 |
| 13 | Elmont | Nassau | 70 |
| 14 | Yaphank | Suffolk | 69 |
| 15 | Uniondale | Nassau | 60 |
| 16 | Baldwin | Nassau | 55 |
| 17 | Bay Shore | Suffolk | 55 |
| 18 | Holtsville | Suffolk | 50 |
| 19 | Hicksville | Nassau | 45 |
| 20 | Roosevelt | Nassau | 42 |
The geographic figures should be interpreted carefully. The ICE field identifies the community recorded as the apprehension city. It does not establish that the person arrested lived in that community, nor does it necessarily represent a conventional street arrest.
Some locations appear to be influenced by government facilities, probation activity, correctional facilities, processing locations and other concentrated enforcement activity.
Different Long Island Communities Show Very Different Arrest Patterns
The underlying records reveal striking differences in the types of arrests recorded in some of the communities with the highest totals.
In Bethpage, 229 of 344 arrests, approximately two-thirds of the total, involved people ICE classified as “Other Immigration Violator.” Another 54 involved people classified as convicted criminals and 61 involved people with pending criminal charges.
The Bethpage records were also overwhelmingly classified as at-large enforcement activity, rather than arrests associated with the 287(g) program. The federal data alone does not explain why Bethpage recorded such a high concentration of apprehensions.
Mineola presents a very different picture. Of approximately 250 arrests recorded there, nearly nine out of 10 involved people ICE classified as convicted criminals.
That pattern is consistent with previously reported immigration enforcement activity involving the Nassau County Probation Department in Mineola. The county’s probation department operates its Administration and Criminal Division at 400 County Seat Drive, and published reports have documented ICE arrests involving immigrants appearing for court-ordered probation appointments.
East Meadow also has an important institutional connection to immigration enforcement. The Nassau County Correctional Center is located there, and federal court records have documented ICE processing at a “Nassau County ICE Intake” location in East Meadow before individuals were placed in or transferred through the county correctional center.
Williston Park showed yet another unusual pattern. A majority of the approximately 100 arrests recorded there were coded in the federal data as associated with the 287(g) Program, an immigration enforcement program involving cooperation between ICE and participating local law enforcement agencies.
Those differences illustrate why apprehension-city totals should not automatically be interpreted as measures of immigration enforcement against residents of each community. In some places, institutional activity can substantially influence the location recorded by ICE.
Nearly Half of Long Island Arrests Classified as “Other Immigration Violator”
LongIslandGuide.com’s analysis also examined the criminality classification attached to each Long Island arrest.
| ICE Classification | Arrests | Share of Long Island Total |
|---|---|---|
| Other Immigration Violator | 1,391 | 47.3% |
| Convicted Criminal | 954 | 32.4% |
| Pending Criminal Charges | 595 | 20.2% |
| Total | 2,940 | 100% |
The terminology above reflects the classifications contained in ICE’s own data. The category “Other Immigration Violator” should not automatically be interpreted as a definitive statement that a person has never had any contact with the criminal justice system. It indicates the criminality category assigned to that apprehension in the ICE dataset.
Overall, approximately 47% of the Long Island arrests were classified as Other Immigration Violator, while about 32% involved people classified as convicted criminals and approximately 20% involved pending criminal charges.
Long Island ICE Arrests Rose Sharply During 2025, Peaked in January 2026
The data also shows a significant change in the pace of immigration arrests over time.
Long Island recorded 222 arrests in June 2025 before monthly totals climbed to 232 in August, 236 in September, 279 in October and 282 in November.
Arrests reached their highest full-month level in January 2026, when 319 ICE apprehensions were recorded across Nassau and Suffolk counties.
Activity then declined substantially. The monthly total fell to 215 in February, 156 in March, 59 in April, 84 in May, 80 in June and just 72 in July 2026.
| Month | Long Island ICE Arrests |
|---|---|
| January 2025* | 13 |
| February 2025 | 50 |
| March 2025 | 37 |
| April 2025 | 87 |
| May 2025 | 71 |
| June 2025 | 222 |
| July 2025 | 215 |
| August 2025 | 232 |
| September 2025 | 236 |
| October 2025 | 279 |
| November 2025 | 282 |
| December 2025 | 216 |
| January 2026 | 319 |
| February 2026 | 215 |
| March 2026 | 156 |
| April 2026 | 59 |
| May 2026 | 84 |
| June 2026 | 80 |
| July 2026 | 72 |
| August 2026* | 15 |
*January 2025 represents only the period beginning Jan. 20. August 2026 is a partial month because the federal release extends only through Aug. 6, with the latest New York apprehension appearing in the analyzed file on Aug. 5.
Comparing full months, the decline from the January 2026 peak of 319 arrests to 72 arrests in July represents a drop of approximately 77%.
Nassau Accounted for More Than Two-Thirds of Long Island Arrests
The geographic split was heavily weighted toward Nassau County.
| Area | ICE Arrests | Share of Long Island Total |
|---|---|---|
| Nassau County | 2,008 | 68.3% |
| Suffolk County | 932 | 31.7% |
| Long Island Total | 2,940 | 100% |
The data also classified 2,655 of the 2,940 Long Island arrests as at-large arrests under ICE’s simplified apprehension-method field. Another 215 were classified as associated with the 287(g) Program.
How LongIslandGuide.com Analyzed the Data
The underlying records were obtained by ICE through federal immigration enforcement systems and released in response to Freedom of Information Act litigation brought by the Deportation Data Project. The project’s latest release contains enforcement records through Aug. 6, 2026.
LongIslandGuide.com filtered the arrest records to New York apprehensions beginning Jan. 20, 2025, then identified entries whose ICE-recorded apprehension city corresponds to communities in Nassau or Suffolk County.
Community names were normalized for capitalization, spelling variations and apparent typographical errors. For example, differently capitalized versions of the same community were treated as one location.
The analysis also excluded likely duplicate arrest records using the Deportation Data Project’s duplicate_episode_first field. The project defines an arrest episode as arrests involving the same individual occurring within 24 hours and flags the first record in each episode for researchers seeking to avoid likely duplicate enforcement records.
Applying that methodology reduced the New York dataset from 19,548 rows to 19,394 arrest episodes. The resulting Long Island analysis identified 2,940 apprehensions recorded in Nassau and Suffolk communities.
The Deportation Data Project cautions that the newly released apprehension-city field appears to be manually entered and sometimes contains inconsistent spellings, errors or missing information. The project says approximately 4% of observations since 2025 have a missing city.
For that reason, the totals in this analysis should be understood as arrests that ICE recorded in Nassau and Suffolk communities rather than a definitive count of arrests involving residents of those communities. The data may also undercount Long Island apprehensions when the city field is missing or cannot reliably be assigned to Nassau or Suffolk.
Key Facts and Details
| Data analyzed | Individual-level ICE administrative arrest records |
|---|---|
| Period analyzed | Jan. 20, 2025 through the August 2026 data release |
| Long Island arrests identified | 2,940 |
| Nassau County | 2,008 |
| Suffolk County | 932 |
| Community with most recorded arrests | Bethpage, 344 |
| Convicted Criminal classification | 954 |
| Pending Criminal Charges classification | 595 |
| Other Immigration Violator classification | 1,391 |
| Peak full month | January 2026, 319 arrests |
| Primary data source | U.S. Immigration and Customs Enforcement data obtained and processed by the Deportation Data Project |
Sources
Primary data: Deportation Data Project, ICE Immigration and Customs Enforcement processed datasets and August 2026 data release. Methodology and definitions: Deportation Data Project ICE data documentation and ICE core data codebook. Additional context: Nassau County Probation Department information, federal court records involving ICE intake and the Nassau County Correctional Center in East Meadow, and previously published reporting concerning immigration enforcement activity in Nassau County.
The newly available city-level federal data provides one of the clearest looks yet at where ICE enforcement activity has been recorded across Long Island, while also showing why the raw location totals require context. Bethpage, Mineola, East Meadow and Williston Park all rank relatively high, but the records reveal markedly different enforcement patterns behind those numbers, underscoring that an apprehension city can reflect not only where agents operate but also where courts, probation offices, correctional facilities and immigration enforcement programs intersect.
Are you ready for fall on Long Island? Check out these local seasonal guides:
🍎 Apple Picking | 🍂 Fall Festivals & Farm Activities | 👻 Haunted Houses | 🎃 Pumpkin Picking