
Long Island Housing Market Pushes Higher as Nassau and Suffolk Prices Rise Despite Slower Sales, Limited Inventory

LONG ISLAND, NY – Long Island home prices continued to rise in August even as fewer single-family houses changed hands, highlighting a housing market where limited supply continues to support prices despite affordability pressures.
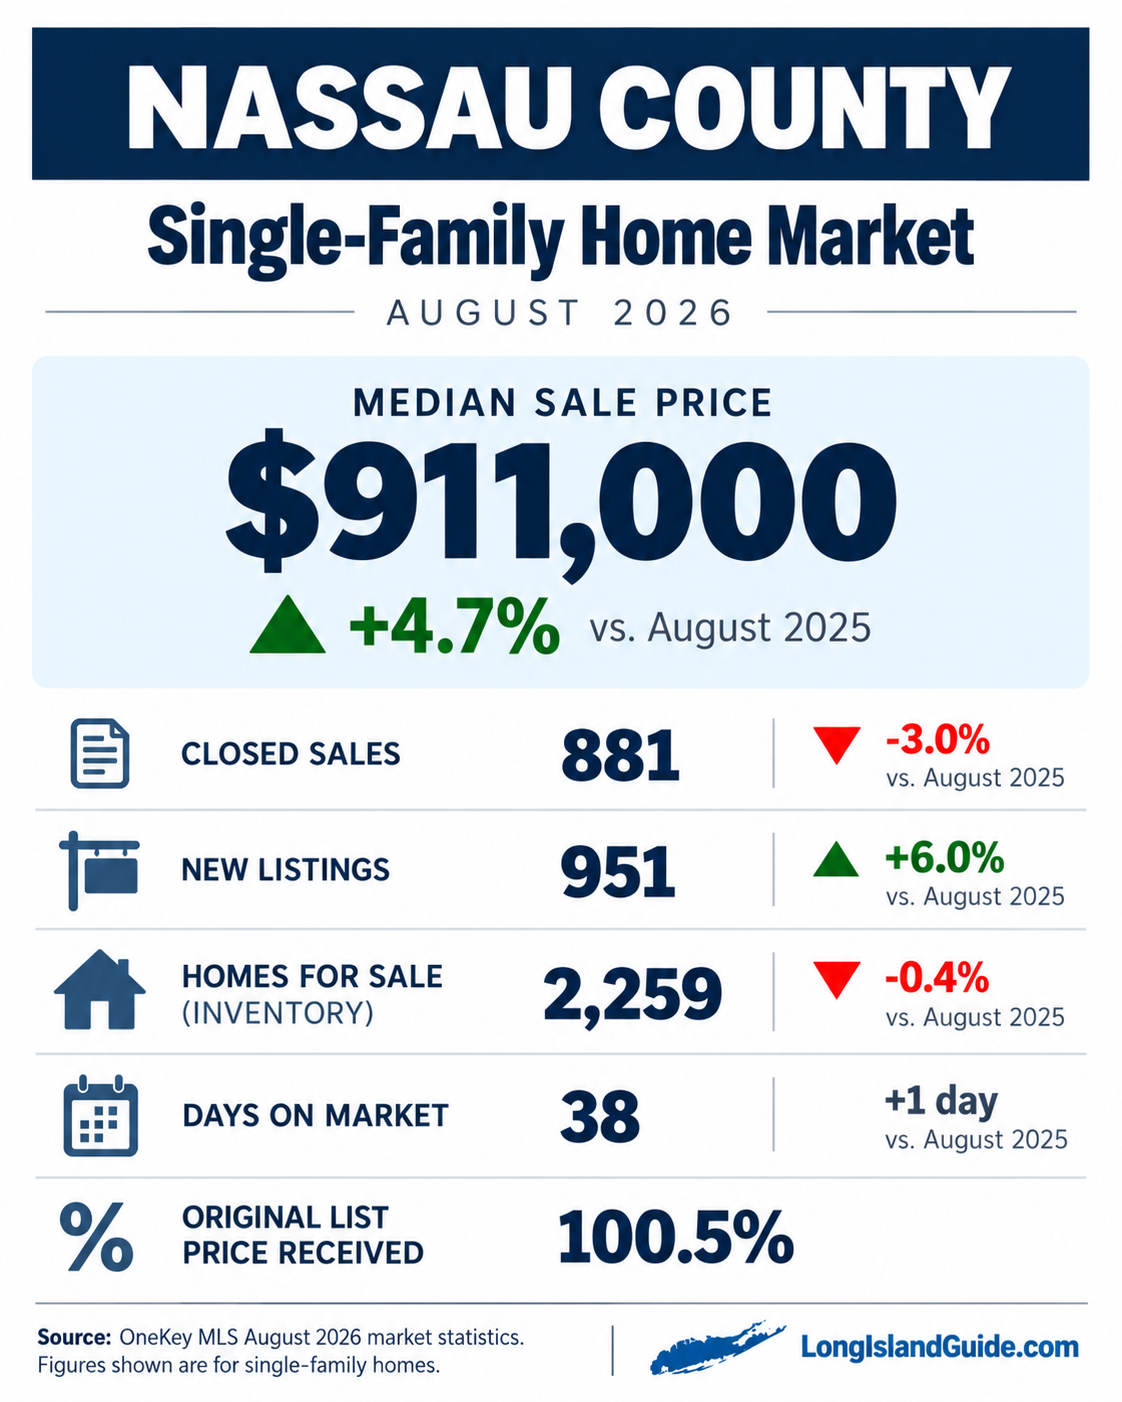
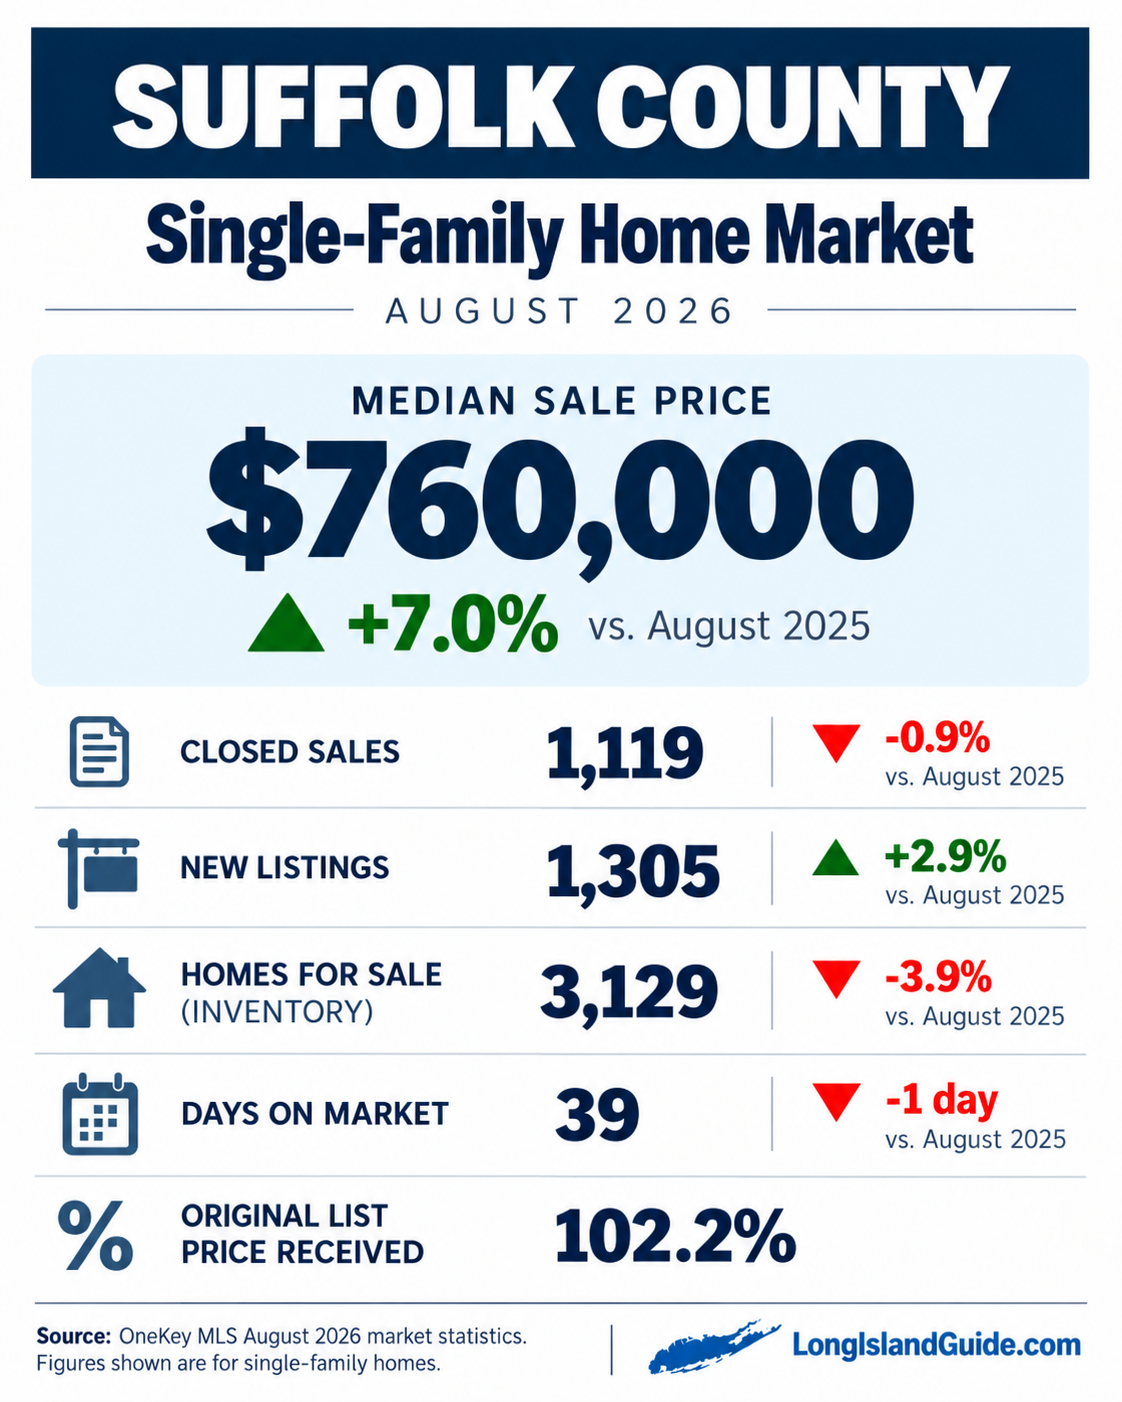
The median price of a single-family home sold in Nassau County reached $911,000 in August 2026, up 4.7% from $870,000 a year earlier, according to OneKey MLS market statistics. In Suffolk County, the median climbed to $760,000, up 7.0% from $710,000 in August 2025. OneKeyMLS
The increase in prices did not come with an increase in sales volume.
Nassau recorded 881 single-family closed sales during August, down 3.0% from 908 a year earlier. Suffolk recorded 1,119 closed sales, down 0.9% from 1,129. The figures were current as of September 8 and were published in OneKey’s August county market reports.
More Homes Were Listed, but Inventory Remained Tight
One of the more revealing parts of the August data is the relationship between new listings and the number of homes actually available for sale.
Nassau County had 951 new single-family listings during August, 6.0% more than the 897 listed in August 2025. Yet total inventory at the end of the period stood at 2,259 homes, slightly below the 2,268 available a year earlier.
Suffolk showed a similar pattern. New listings increased 2.9%, from 1,268 to 1,305, but inventory fell 3.9%, from 3,255 homes to 3,129.
That means more homeowners put properties on the market during August in both counties, but the overall stock of available single-family homes did not increase.
The numbers suggest that new supply continues to be absorbed quickly enough to keep inventory constrained, particularly in Suffolk.
Suffolk Sellers Received More Than Their Original Asking Price
Competition for single-family homes also remained visible in the relationship between asking prices and final sale prices.
Suffolk sellers received a median 102.2% of their original list price in August, up from 101.3% a year earlier. In Nassau, sellers received 100.5% of their original asking price, compared with 100.1% in August 2025.
Homes also continued to sell relatively quickly.
The typical Nassau single-family home that closed in August spent 38 days on the market, compared with 37 days a year earlier. In Suffolk, the figure declined slightly from 40 days to 39.
Those figures do not describe every transaction, and individual communities can differ substantially from the countywide market. But they indicate that, at the county level, buyers were still competing for a relatively limited supply of homes.
The Longer-Term Numbers Show the Same Direction
August’s increase was not simply the result of one unusually strong month.
For the 12-month period through August, Nassau County’s median single-family sale price was $860,000, up 5.5% from $815,000 during the comparable period a year earlier. Suffolk’s 12-month median increased 5.9%, from $680,000 to $720,000.
Sales volume, meanwhile, barely changed.
Nassau recorded 8,271 single-family sales during the 12 months through August 2026, virtually unchanged from 8,272 in the previous comparable period. Suffolk recorded 10,969 sales, down 0.9% from 11,065.
The combination shows that rising prices have continued even without meaningful growth in the number of homes being sold.
Condos and Co-ops Told a Different Story
The single-family market was not representative of every type of housing.
In Nassau County, the median condo sale price fell 10.8% year over year in August to $740,000, while the co-op median declined 5.0% to $380,000. However, those figures were based on just 74 condo sales and 71 co-op sales during the month, and OneKey cautions that percentage changes can appear unusually large when sample sizes are small.
Suffolk’s condo market moved in the opposite direction. The median condo price rose 4.7% to $570,000, while the co-op median increased 3.0% to $257,500. Suffolk condo inventory fell sharply, dropping 24.8% from 404 units to 304.
Those differences are another reason not to treat a single countywide figure as representative of every segment of Long Island real estate.
Long Island Remains Part of a Broader High-Price Regional Market
Across the entire OneKey MLS service area, which covers 11 counties in the New York metropolitan region, the median sale price for all property types increased 4.4% year over year in August to $741,500. Closed sales declined 0.5%, while new listings increased 3.5% and the number of homes for sale increased 1.3%.
OneKey described the regional market as one in which buyers had somewhat more choice than a year earlier, while affordability remained constrained by high home prices and borrowing costs.
Long Island’s county numbers, however, show that additional supply has yet to translate into meaningfully larger inventories of single-family homes.
Key Facts & Details
| Measure | Nassau County | Suffolk County |
|---|---|---|
| August 2026 median single-family price | $911,000 | $760,000 |
| Change from August 2025 | +4.7% | +7.0% |
| August closed sales | 881 | 1,119 |
| Change in closed sales | -3.0% | -0.9% |
| New listings | 951 | 1,305 |
| Change in new listings | +6.0% | +2.9% |
| Homes for sale | 2,259 | 3,129 |
| Inventory change | -0.4% | -3.9% |
| Days on market | 38 | 39 |
| Original list price received | 100.5% | 102.2% |
Source: OneKey MLS August 2026 Nassau and Suffolk County market reports. Figures are for single-family homes and were current as of September 8, 2026.
The August data reinforces a pattern that has defined much of Long Island’s housing market: home prices can continue rising even when transaction volume is stagnant or declining if the number of homes available for purchase remains constrained. In August, more owners listed homes in both counties, but inventories still failed to grow, while buyers continued paying around or above original asking prices.
For prospective buyers, that means fewer sales do not necessarily translate into lower prices. For homeowners considering selling, the latest numbers show that limited supply continues to give sellers considerable leverage across much of the single-family market.
Are you ready for fall on Long Island? Check out these local seasonal guides:
🍎 Apple Picking 🍓 Strawberry Picking 🎃 Pumpkin Picking 👻 Haunted Houses 🍂 Farm Festivals